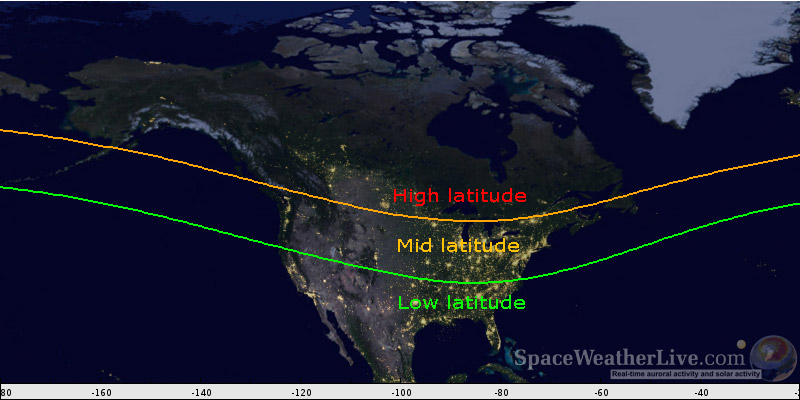
General Space Weather
SDO AIA 171 Å

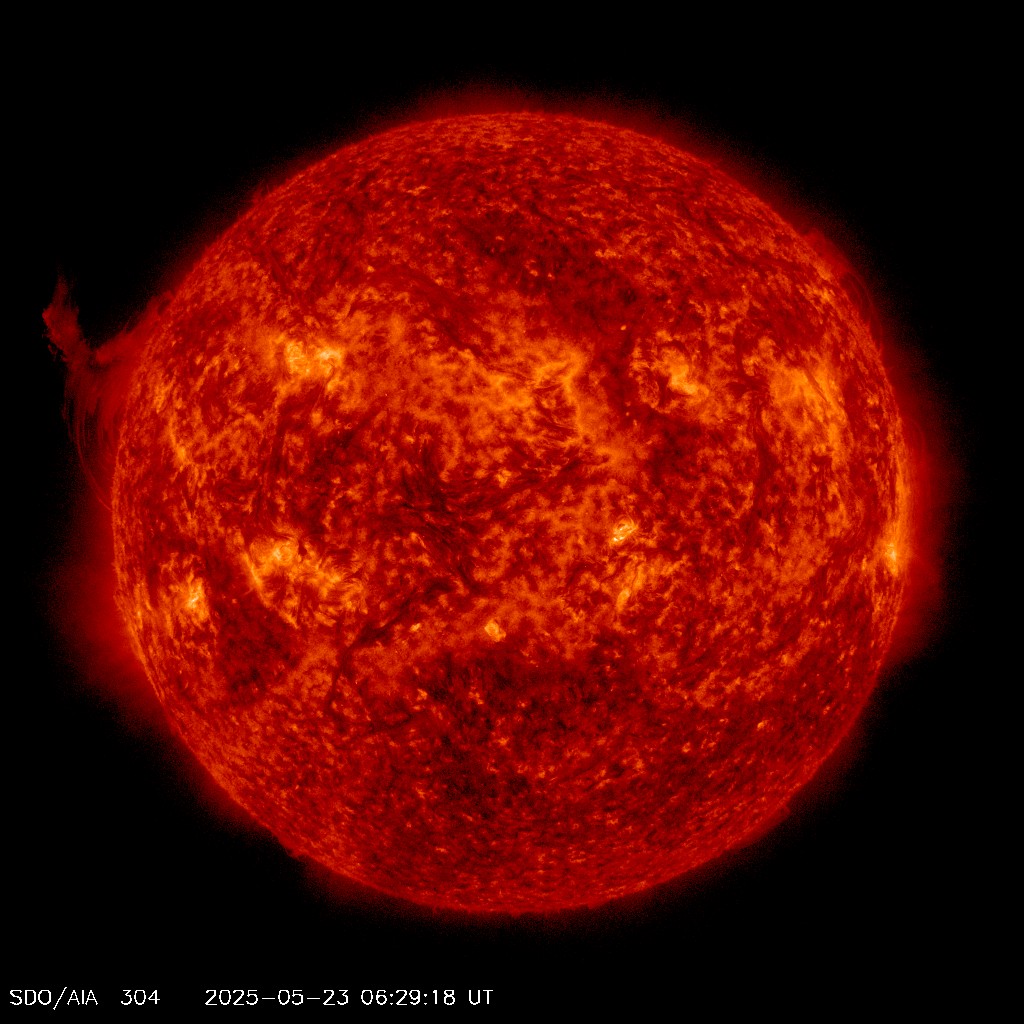
SDO AIA 304 Å
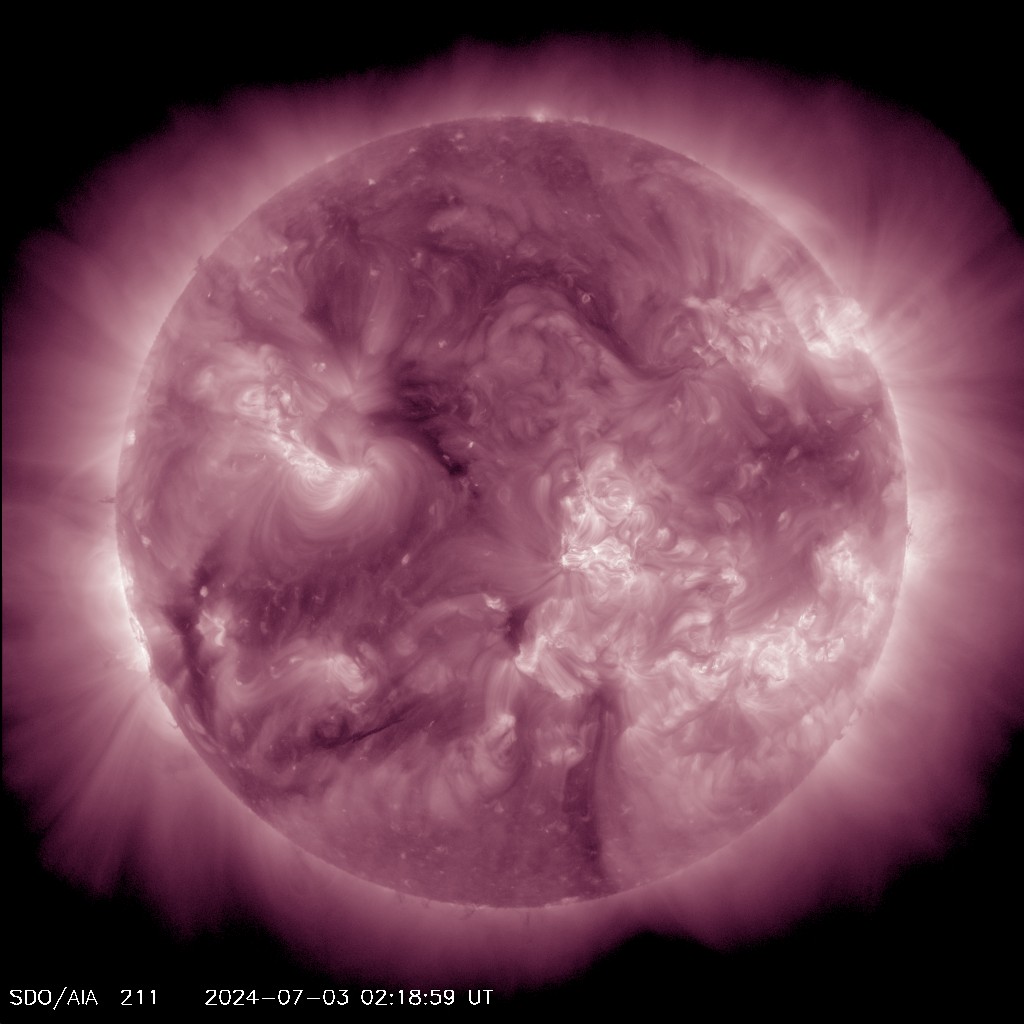
SDO AIA 211 Å
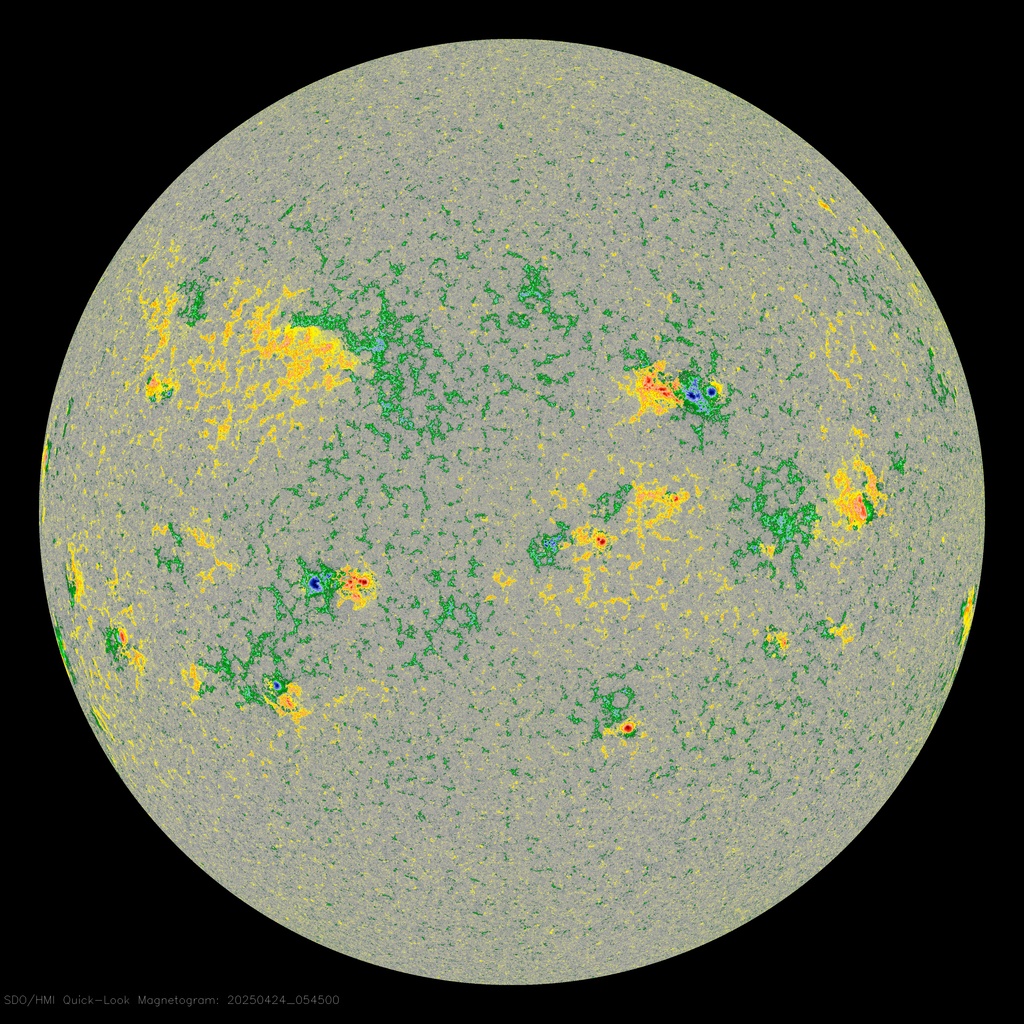
SDO HMI Magnetogram
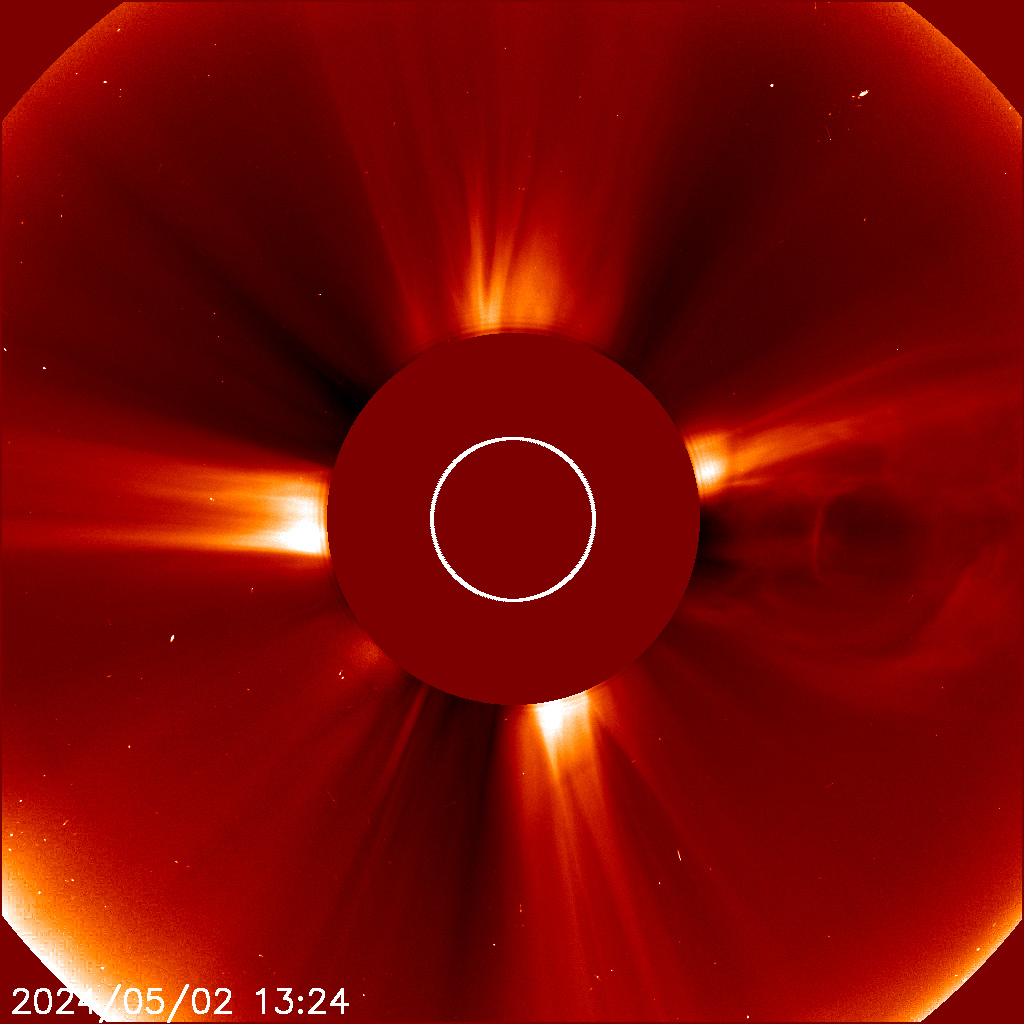
SOHO LASCO C2
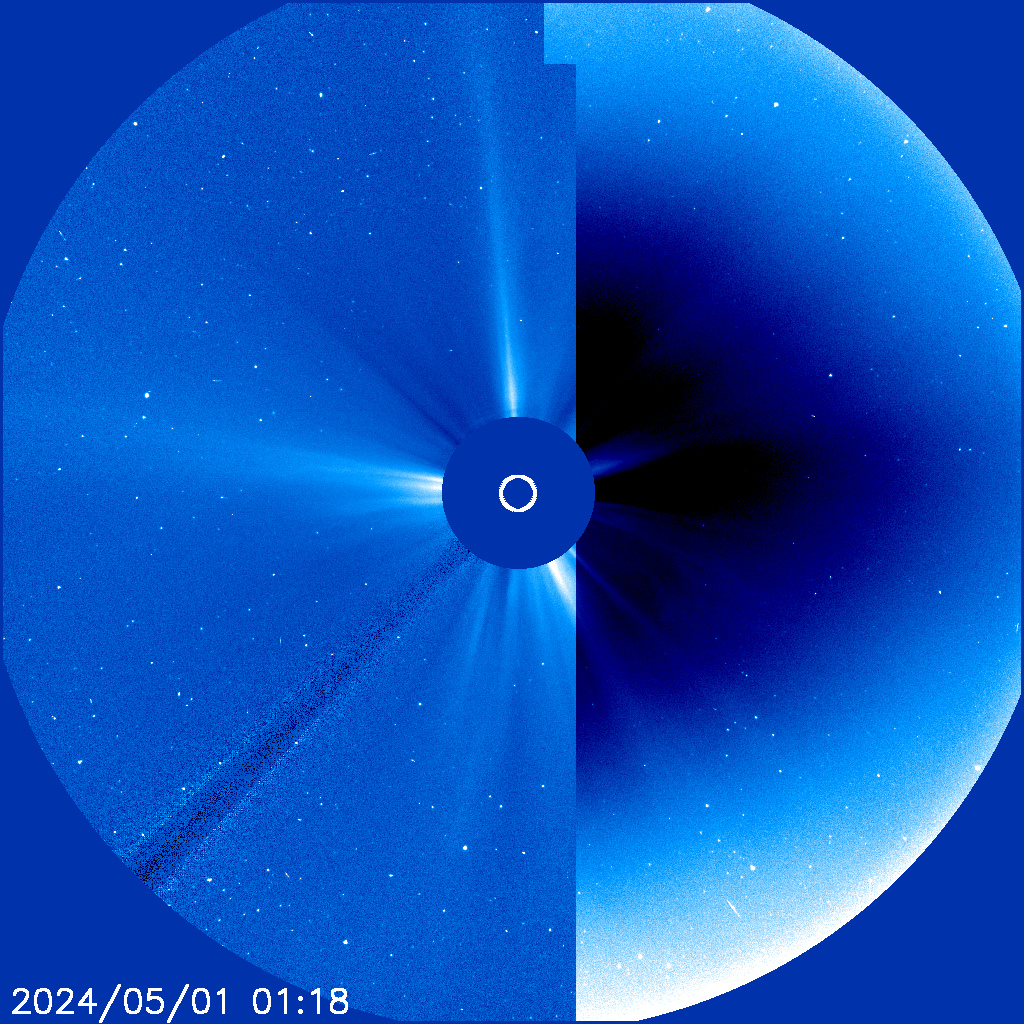
SOHO LASCO C3
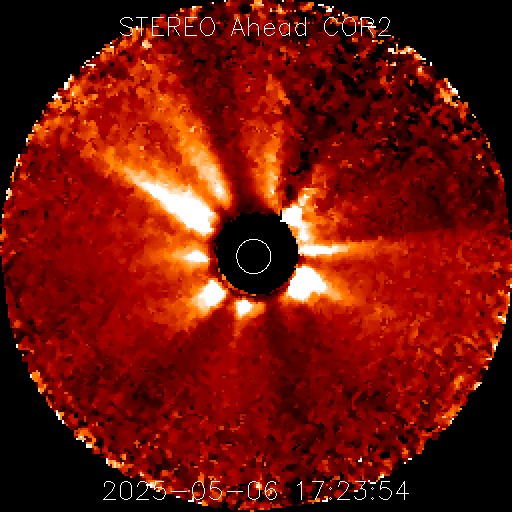
STEREO-A COR2
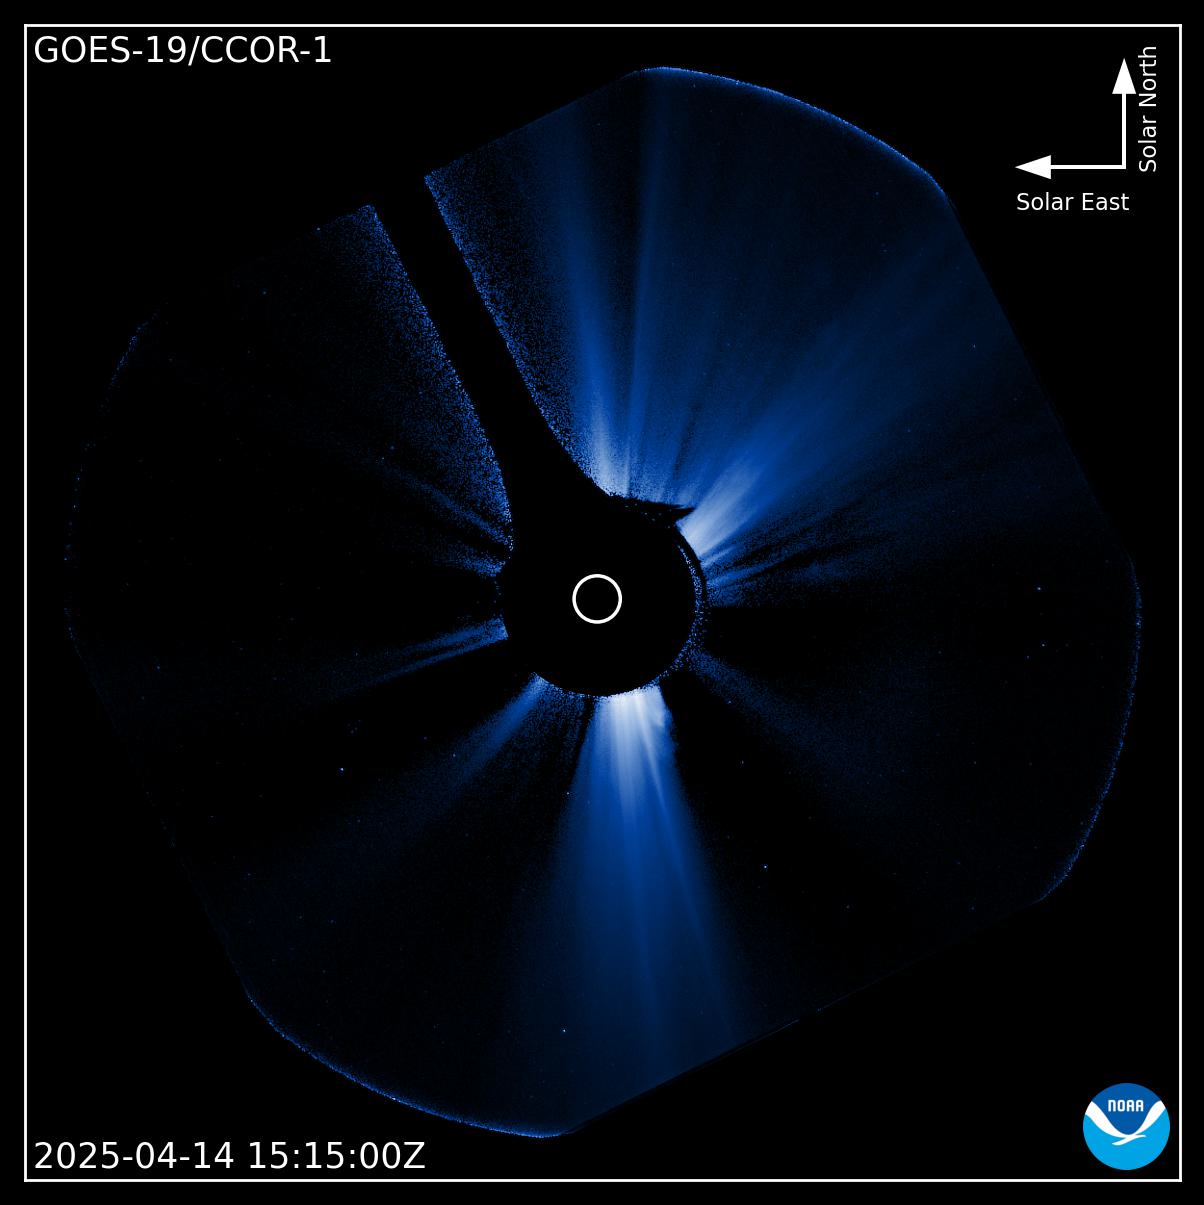
CCOR1 Coronagraph
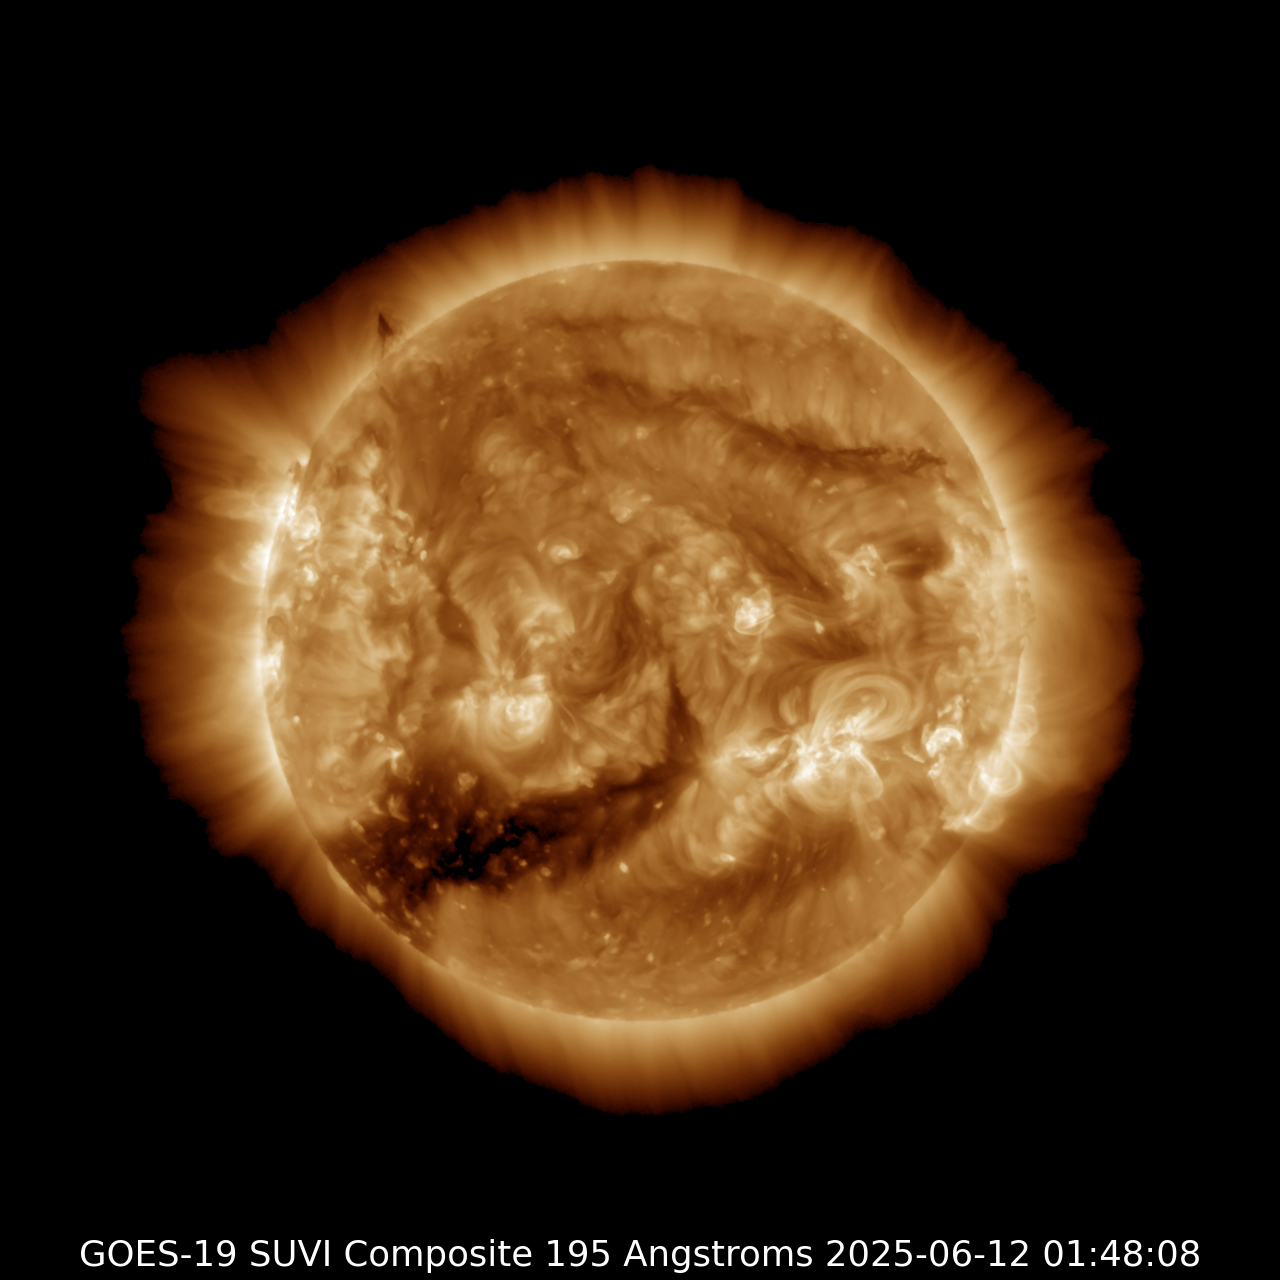
SUVI Coronal Holes (195 Å)
Current Active Regions
Loading active regions...
Data refreshes automatically every 30 minutes.
Recent Solar Flares
Loading recent flares...
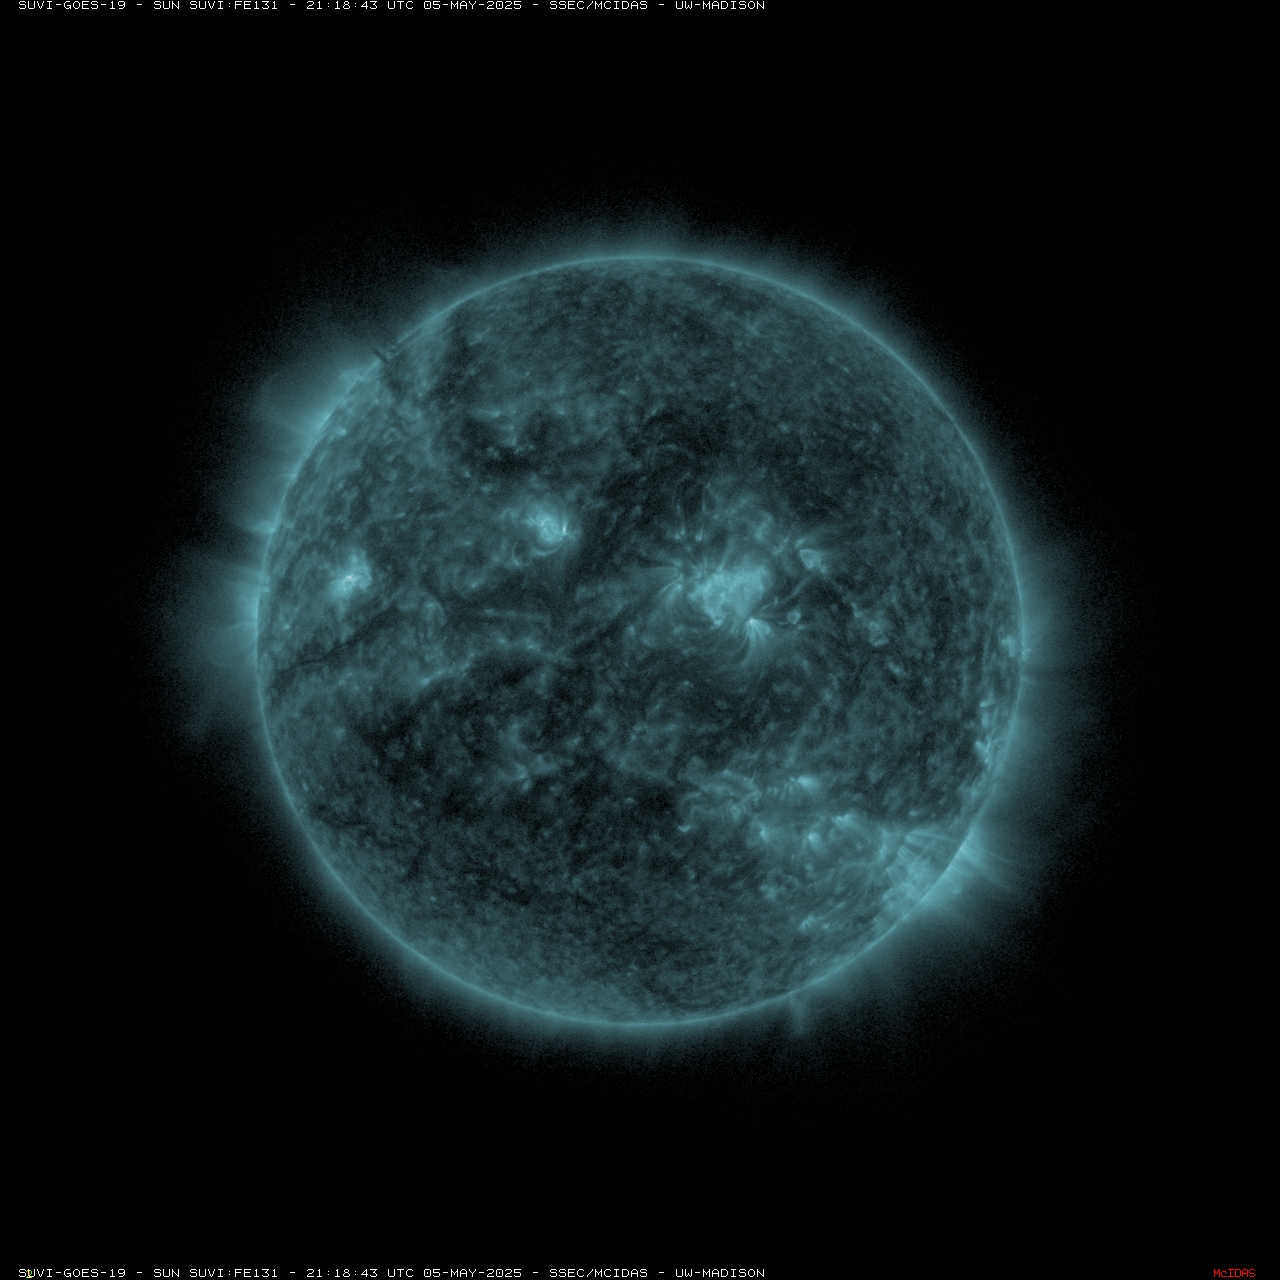
SUVI Full Sun (131 Å)